

Liver disease
A global health concern
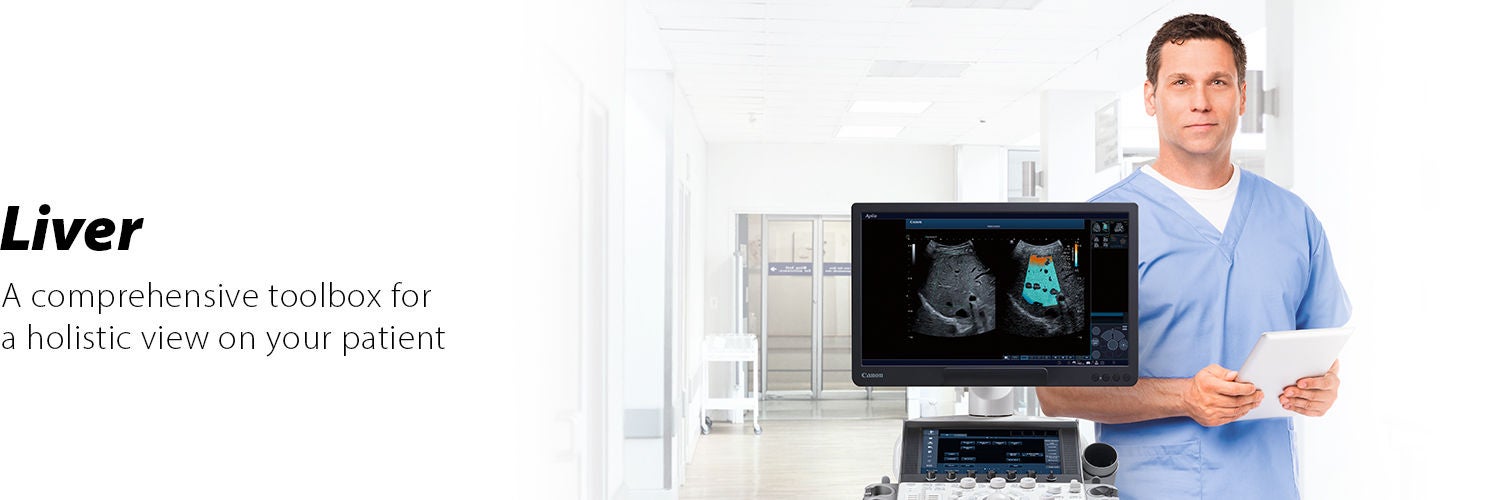
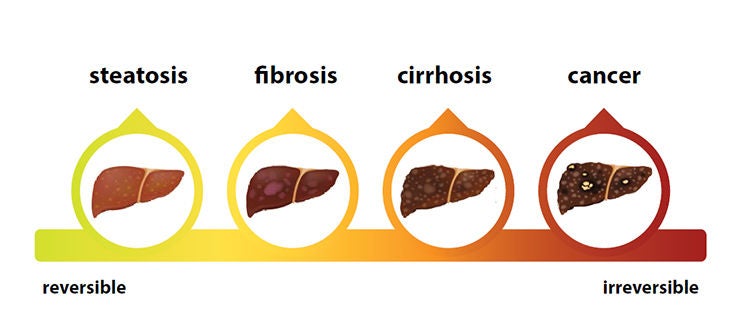
With increasing prevalence, Metabolic Dysfunction Associated Steatotic Liver Disease (MASLD) is the most common cause of chronic liver disease worldwide and a growing public health concern. It is a silent condition that can progress from steatohepatitis into fibrosis, and eventually cirrhosis – a major factor for liver transplants and mortality.
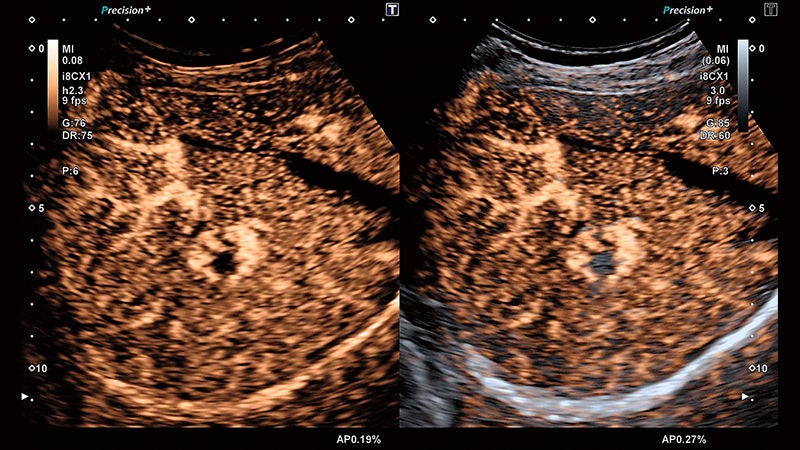
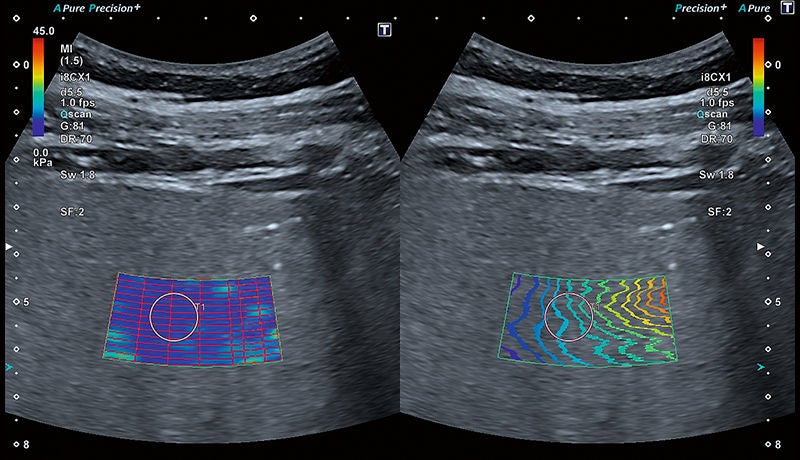
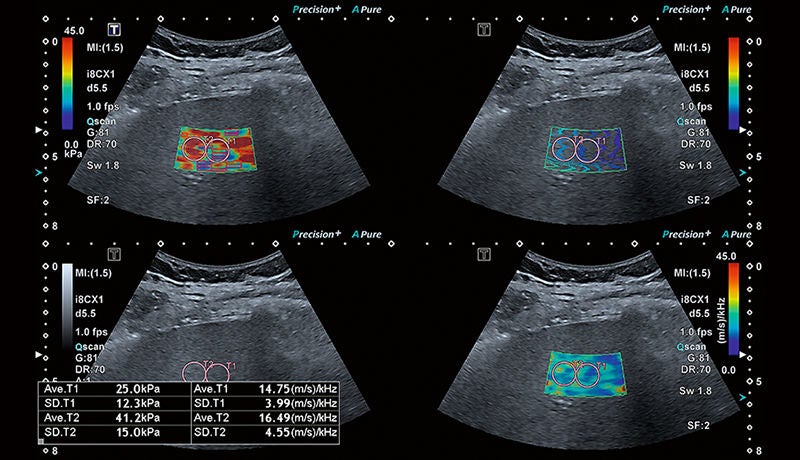
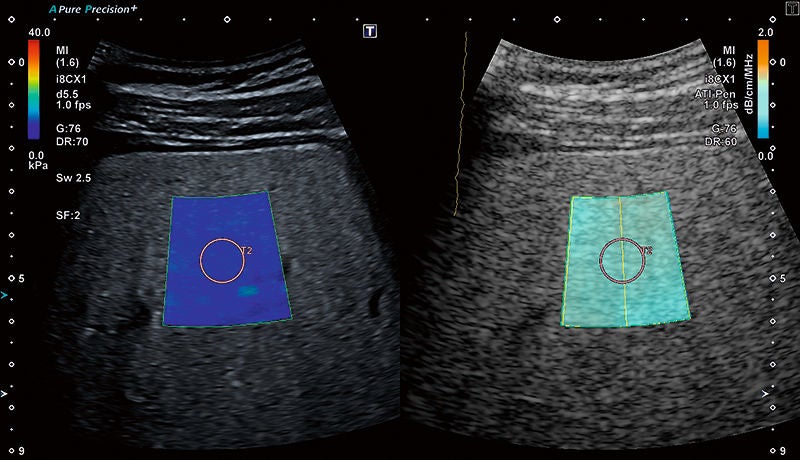
Canon’s liver analysis package offers proven methods for multiparametric screening, assessment and staging of liver disease. Within minutes, you can obtain a comprehensive liver status during a routine examination, establish a diagnosis for your patient and potentially reduce time-consuming and invasive biopsies.
Rapid diagnoses
as part of
a routine exam
as part of
a routine exam
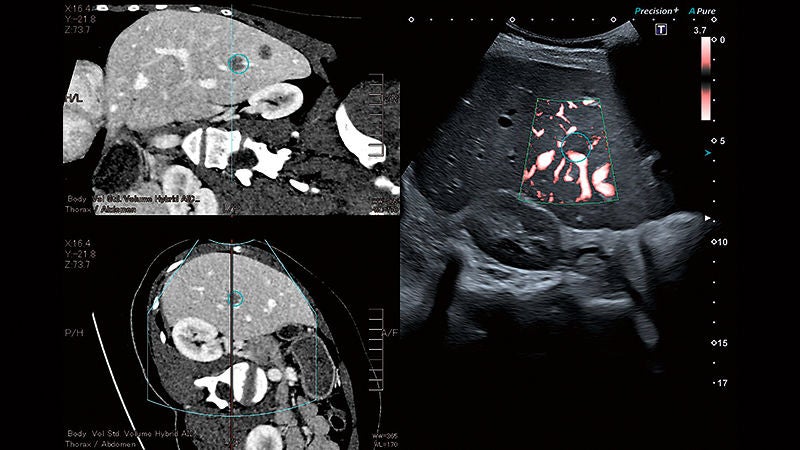
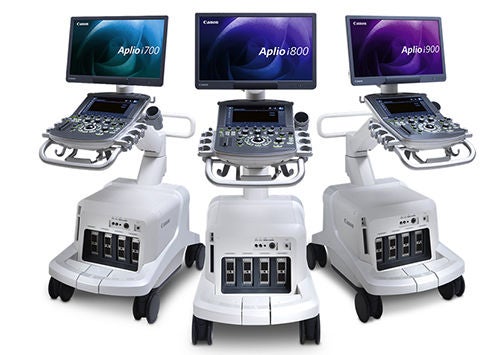
Aplio’s Liver Package can help you streamline your hepatology workflow. When clinically required, additional imaging tests are quickly carried out as part of your routine exam and the quantitative results are readily available for integrated treatment planning.
Reliable applications,
extensively clinically
published
extensively clinically
published
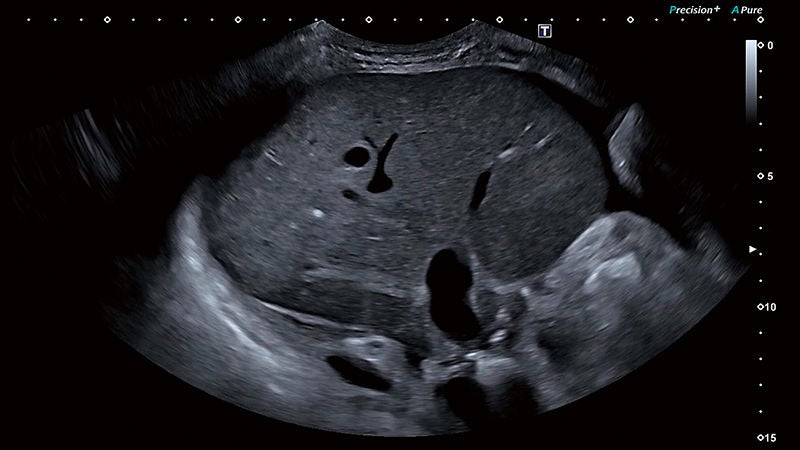
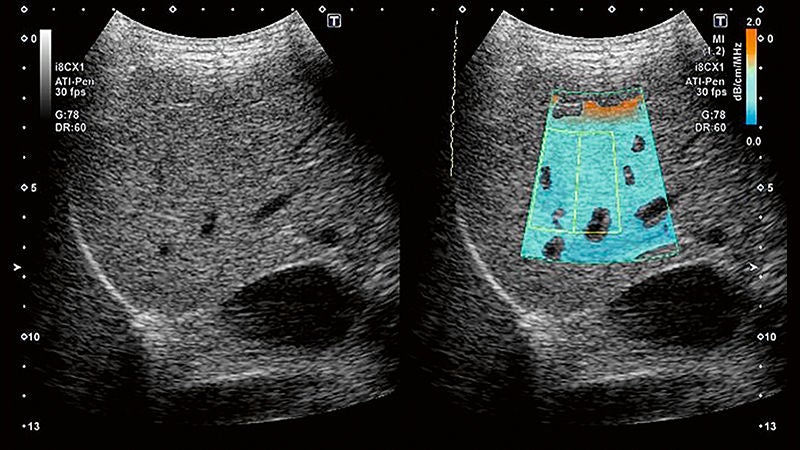
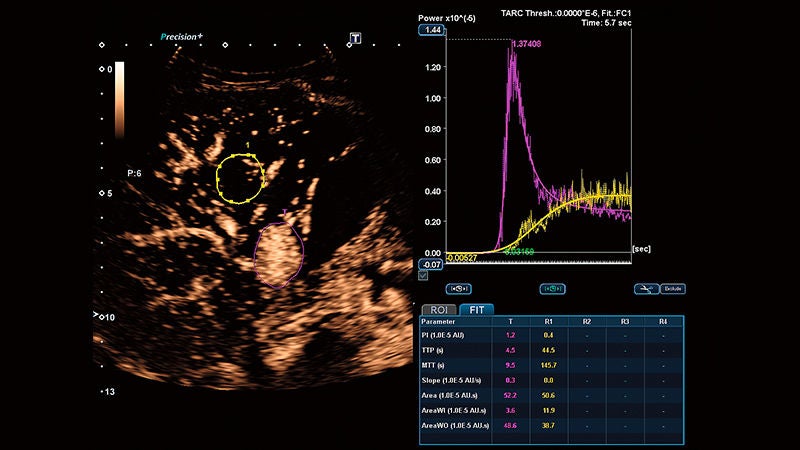
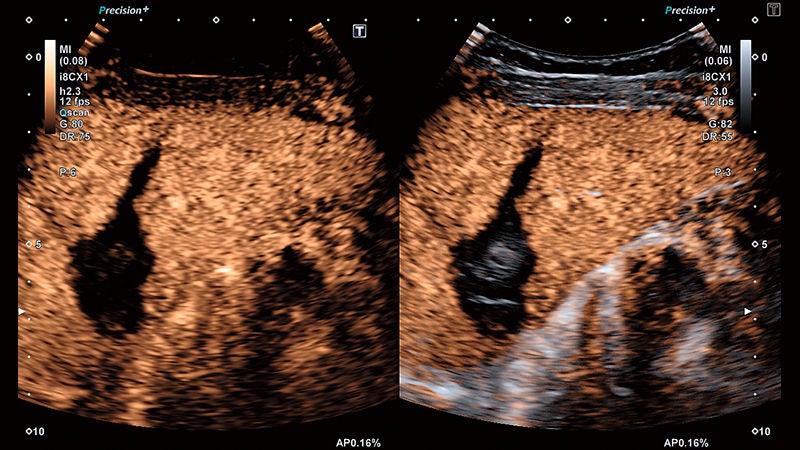
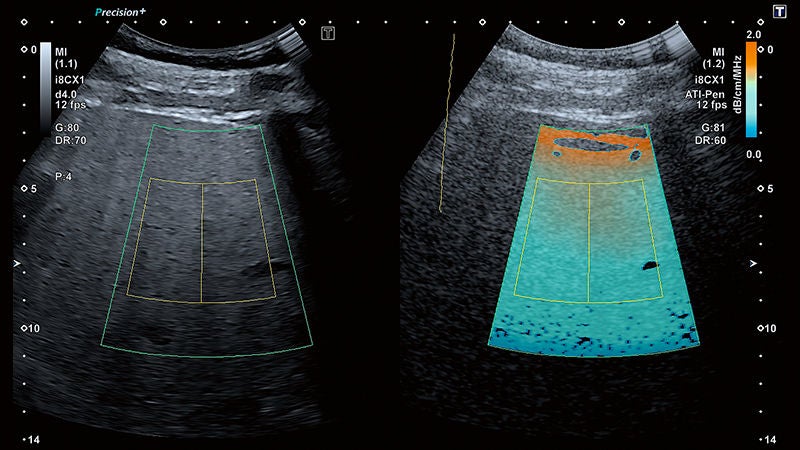
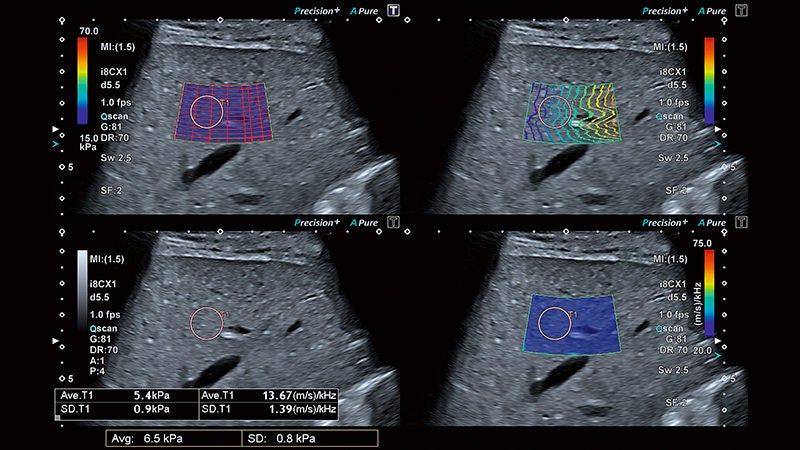
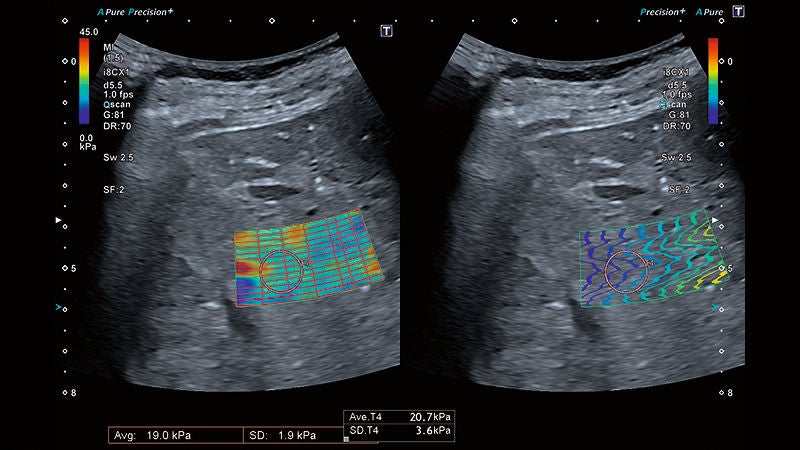
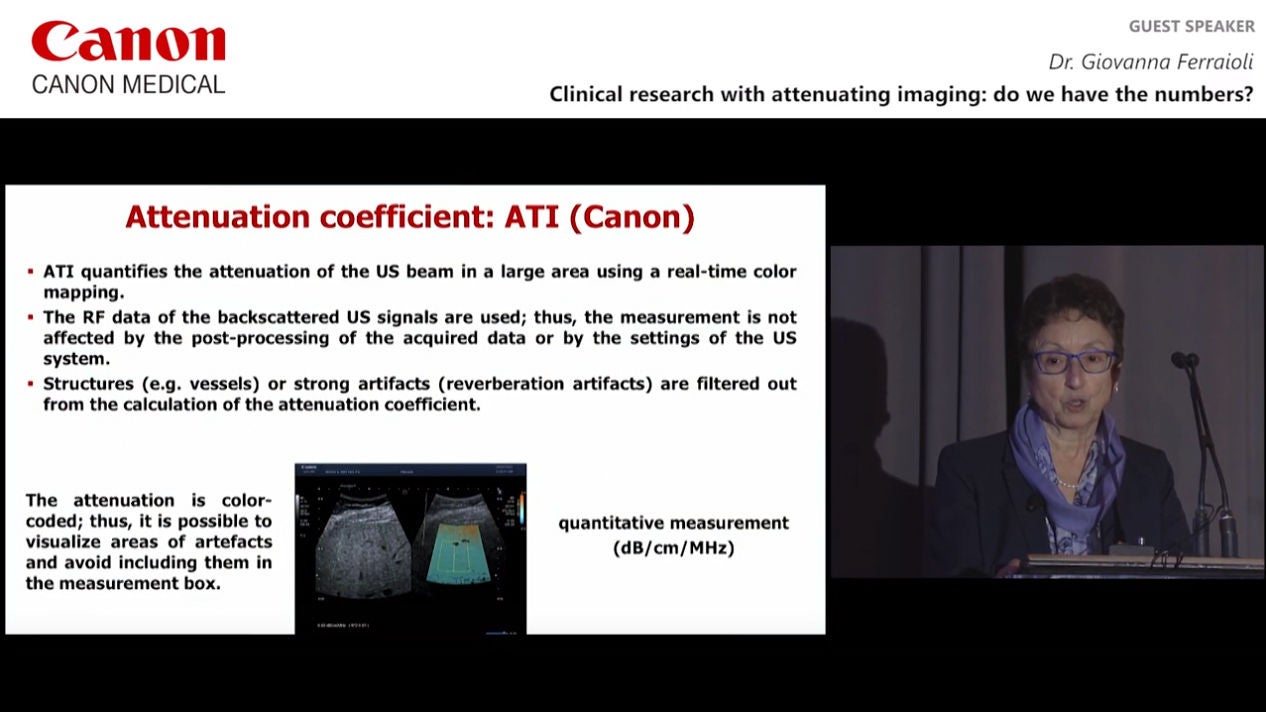
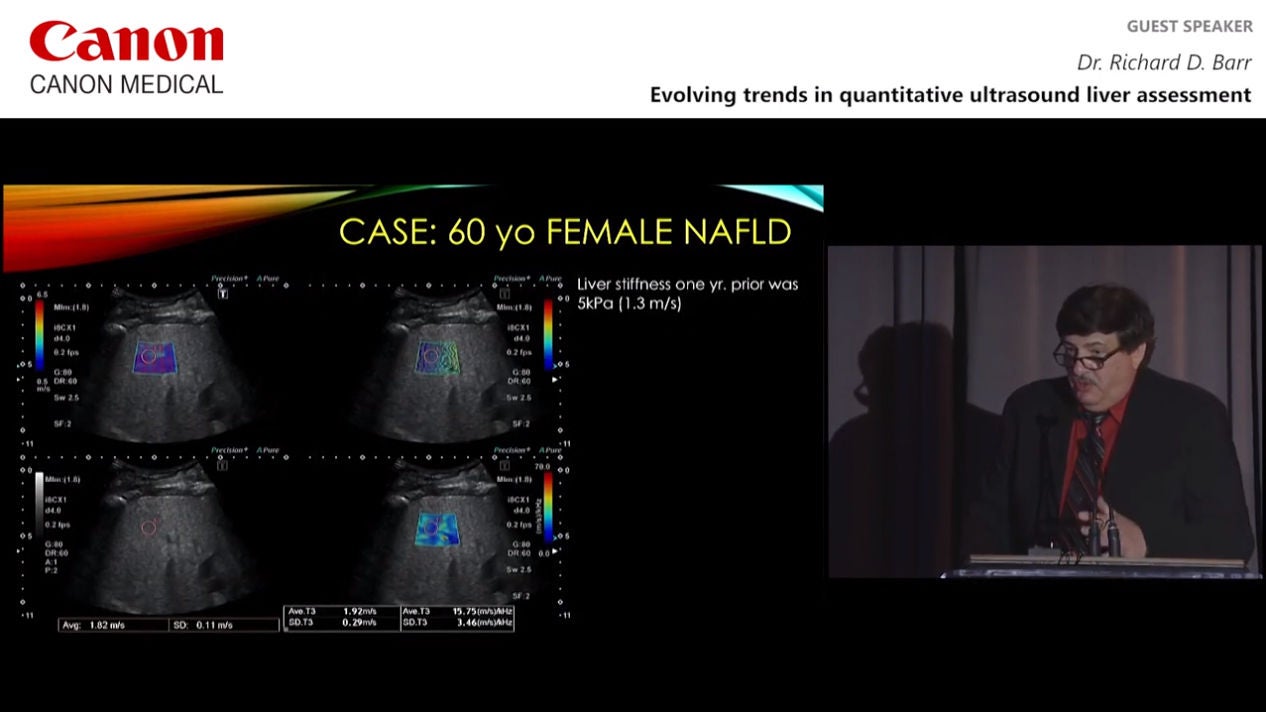
In various independent peer-reviewed publications, physicians have reported the usefulness and reliability of parametric liver imaging for staging diffuse liver disease, including quantification of liver fat and quantitative assessment of parenchymal viscoelasticity.
Clear documentation
for immediate
decision support
for immediate
decision support
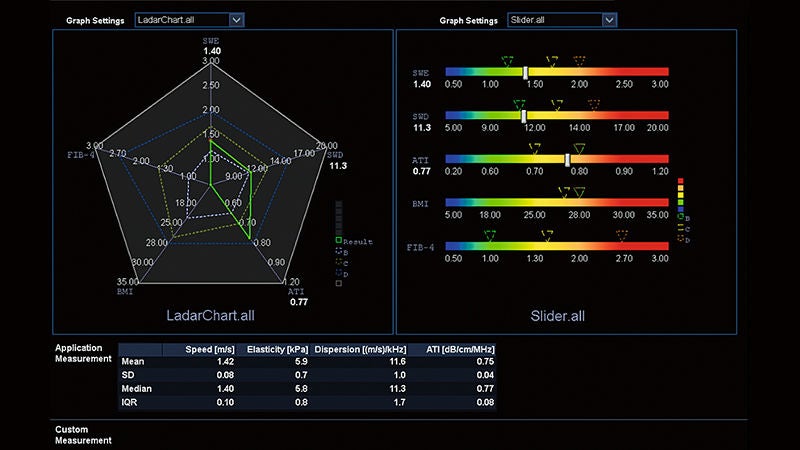
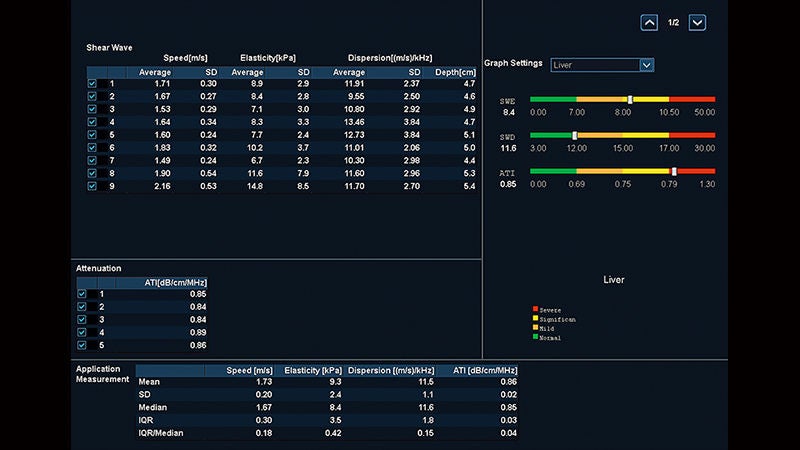
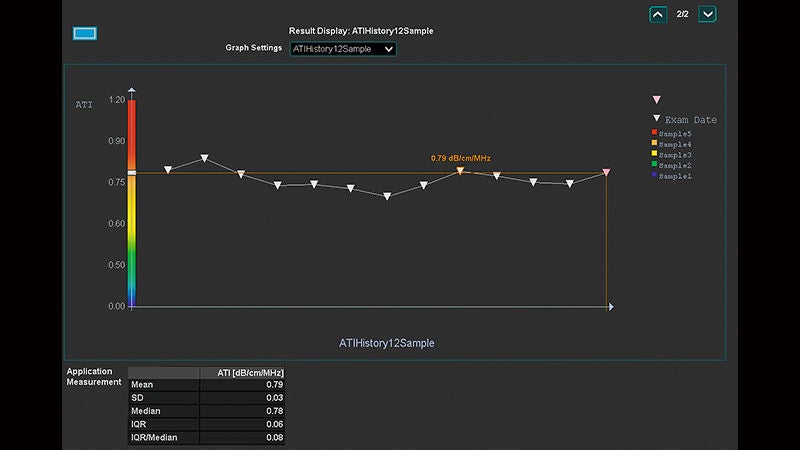
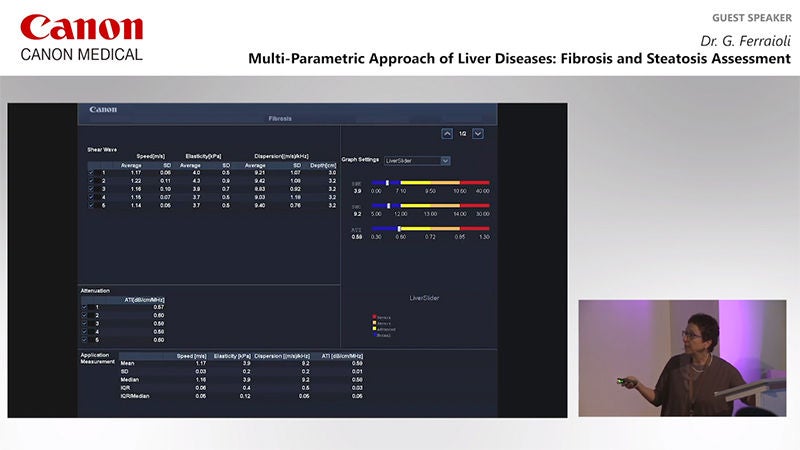
Canon’s intuitive Multi Parametric Report summarizes all results of a liver exam, including external values. While a color bar or spider graph displays easy-to-understand information, the trend graph provides quick feedback on the progression of measurement results.
Comprehensive quantification tools
Elaborate workflow for confident decision-making
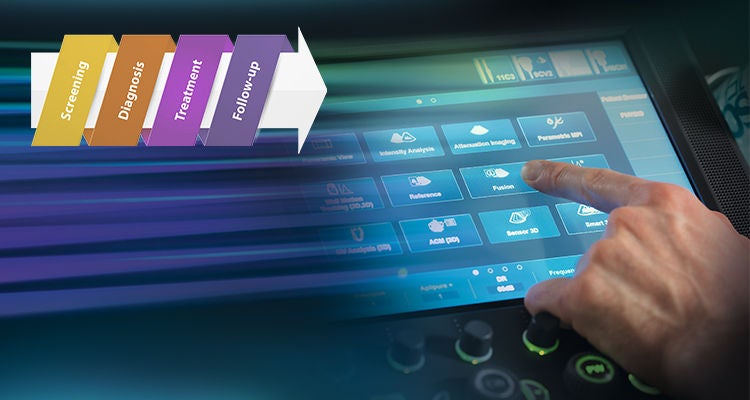
With just a few clicks, Canon’s comprehensive Liver Package allows you to capture a comprehensive status in minutes, providing robust measurement results that can support a reliable diagnosis. Summarized in a concise report, the readings may allow clinicians to make fast assessments and treatment decisions and support regular patient follow-up.
Faster, reliable results
As much as we at Canon strive to provide high quality imaging and quantitative measurement techniques, it is important to us that the results are available quickly and easily. That’s why we work with our users to develop innovative operating concepts and workflow automation solutions, that can allow you to achieve comprehensive, consistent results in less time.
Education and resources

Seeking for more information? We can help.

Social Media


